The Results Tab
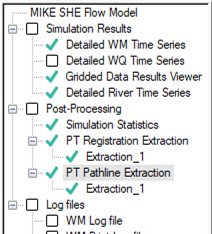
All the simulation results are collected in the Results tab. This includes Detailed time series output for both MIKE SHE and the river model, as well as Grid series output for MIKE SHE.
A Run Statistics tool is available for helping you assimilate the calibration statistics for each of the detailed time series plots.
The Results post-processing section contains options for post-processing the random walk particle tracking results.
1. Detailed Time Series Results
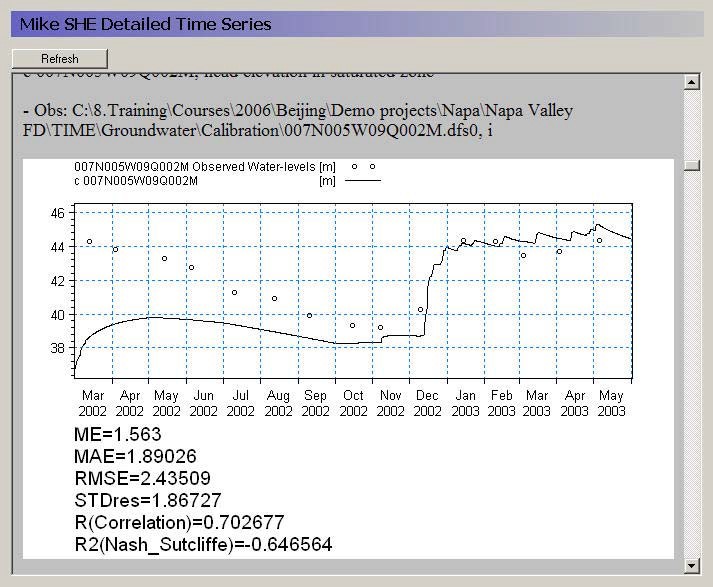
The MIKE SHE Detailed time series page includes an HTML plot of each point selected in the Setup Editor. The HTML plots are updated during the simulation whenever you enter the view. Alternatively, you can select the Refresh button to refresh the plot.
For information on the statistics see Statistic Calculations.
2. Gridded Results
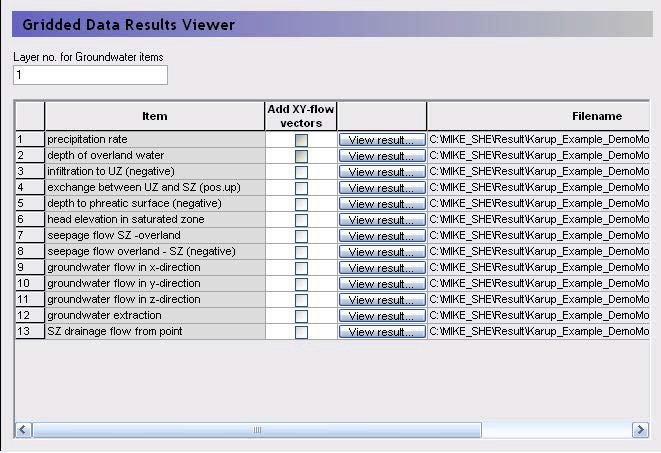
Gridded data results for MIKE SHE can be viewed by selecting the Gridded Data Results Viewer item on the Results tab. The table is a list of all gridded data saved during a MIKE SHE simulation. The items in this list originate from the list of items selected in the Grid series output dialogue from the Setup tab.
Clicking on the View result button will open the Results Viewer to the current item. All overlays from MIKE SHE (e.g. shape files, images, and grid files) will be transferred as overlays to the result view. However, the River Network is not transferred as an overlay.
Layer number
For 3D SZ data files, the layer number can be specified at the top of the table. However, the layer number can also be changed from within the Results Viewer. By default, the top layer is displayed.
Vectors
Vectors can be added to the SZ plots of results, by checking the Add X-Y flow vectors checkbox. These vectors are calculated based on the Groundwater flow in X-direction and Groundwater flow in Y-direction data types if they were saved during the simulation.
In the current version, velocity vectors cannot be added for overland flow output.
The “Overwrite existing file” warning
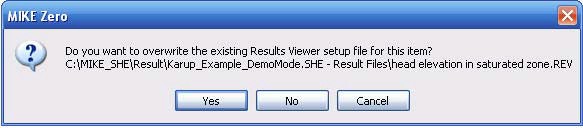
When the Result Viewer opens one of the items in the table, it creates a setup file for the particular view with the extension .rev. The name of the current .rev file is displayed in the title bar of the Results Viewer.
Initially, the .rev file includes the default view settings and the overlay information from MIKE SHE. However, if you make changes to the view, such as changes in the way contours are displayed, when you close the view, you will be asked if you want to save your changes. The .rev file can be opened directly at any time and your results will be displayed using the saved settings.
However, the next time you open the item in the table, you will be asked if you want to overwrite the existing .rev file. If you click on “Yes”, then a new .rev file will be created. If you click on “No”, then your previous settings will be reloaded, and your results will open with the settings from the previous time you opened these results.
3. Detailed River Time Series Results
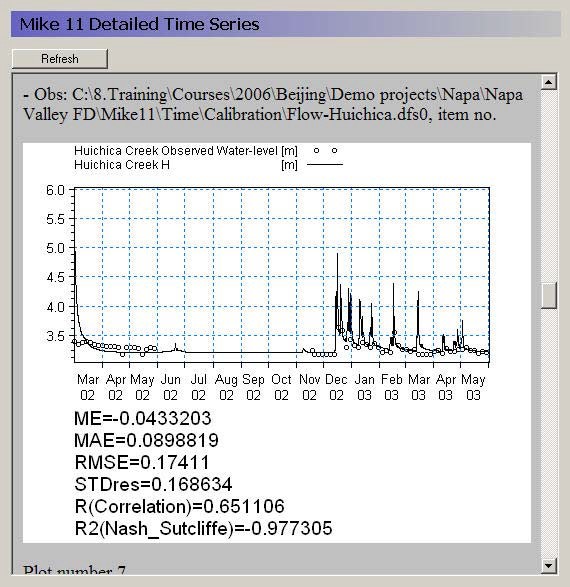
The Detailed River Time Series page includes an HTML plot of each point selected in the Setup Editor. The HTML plots are updated during the simulation whenever you enter the view. Alternatively, you can select the Refresh button to refresh the plot.
For information on the statistics see Statistic Calculations.
4. Run Statistics
Run statistics can be generated in HTML format for a MIKE SHE simulation. The run statistics table information can be copied and pasted directly into any word processing program, such as Microsoft Word, or spreadsheet, such as Microsoft Excel. The Run Statistics HTML document includes MIKE SHE and river model results for all Detailed Time Series items that have observation data.
To calculate Run Statistics for a simulation, navigate to the Results Tab and the Run Statistics item on the menu tree. Press the Generate Statistics button on the Run Statistics window to perform the statistical calculations. For some simulations with long simulation periods and/or a lot of calibration data it can take a while to generate the run statistics.
After successful completion of the Generate Statistics phase, the Run Statistics HTML document will be displayed in the window on the Run Statistics page (see below).
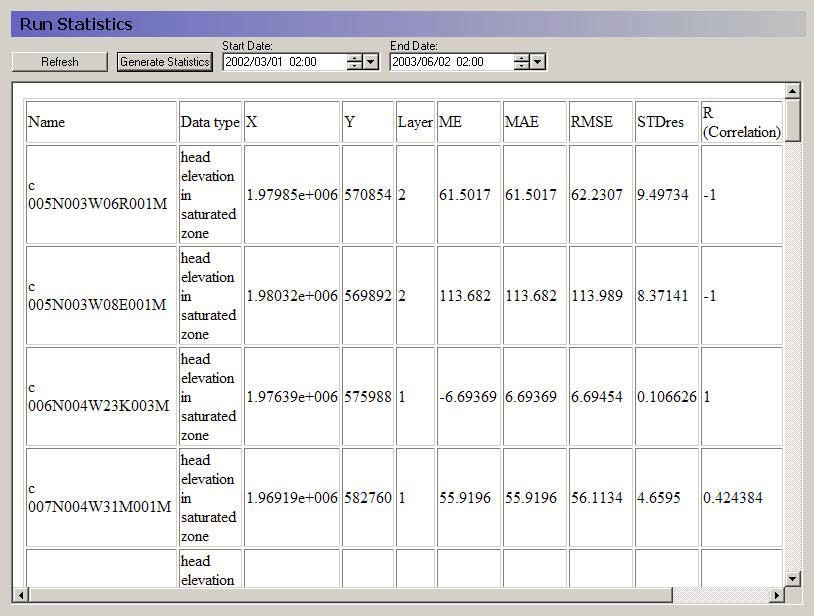
Similar to the detailed time series output, the Run Statistics can be viewed during a simulation. Press the Refresh button on the Run Statistics page to update the Run Statistics using the most recent model results during a simulation.
For information on the statistics see Statistic Calculations.
Shape file output for run statistics
A shape file of statistics is also generated when the html document is generated. The shape file contains all of the information contained in the HTML document and can be used to generate maps of model errors that can be used to evaluate spatial bias. The shape file is created in the simulation directory and is named ProjectName_Stat.shp where ProjectName is the name of the *.she file for the simulation.
Note
The Run Statistics shape file does not have a projection file associated with it and this file should be created using standard ArcGIS methods.
The statistics contained in the HTML document and the shape file are calculated using the same methods used to calculate statistics for the detailed time series output. The reader is referred to the Detailed Time Series Output section for more information on how the statistics are calculated.